Numbers pulled from several places
Then pasted into one sheet
Track occupancy, revenue and performance across every site in real time, and build the exact reports you need in a couple of clicks.Occupancy, revenue, move-ins, overdue rent and churn for each site, plus reports you can filter and export when an owner, partner or lender asks how things are going.
Hours go into reports that should already exist.
Then pasted into one sheet
The same report, every month
Big units skew the picture
Once it's two months old
No way to compare them
And waiting days for it
Self-storage reporting software turns the data from your bookings, rentals and invoices into dashboards and reports: occupancy, revenue, move-ins and move-outs, overdue balances. Good self-storage analytics let you compare sites, spot a site slipping before month end, and send an owner or lender the numbers without rebuilding a spreadsheet.
Occupancy by unit count or by area
Revenue, utilization and average revenue per rental
Move-ins, move-outs, churn and tenure
Exports to CSV, Excel or PDF
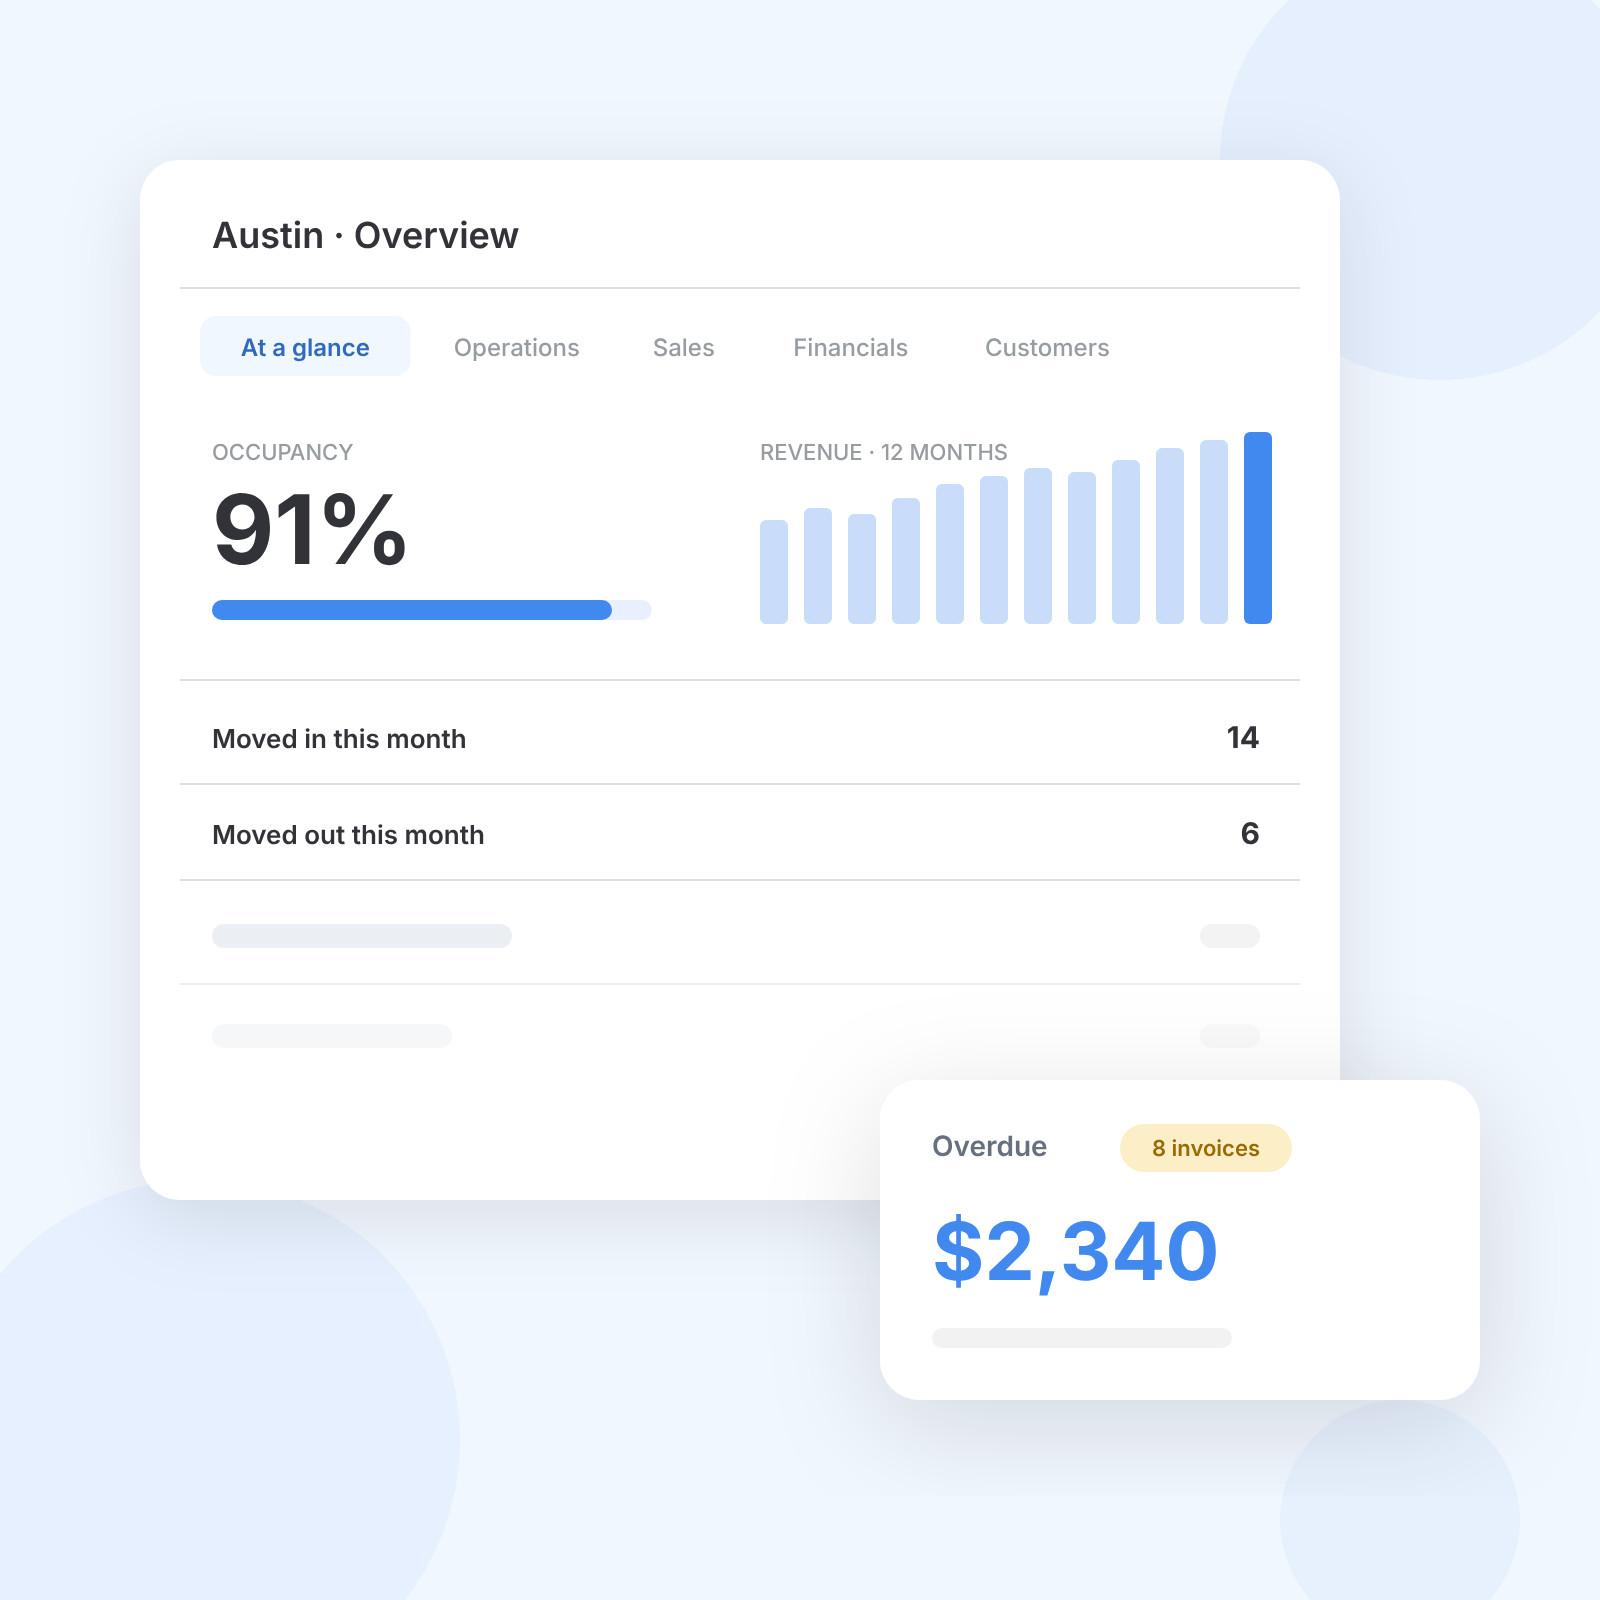
Every site has an Overview tab for the day-to-day picture. The Analytics dashboard adds pre-built reports you can filter, drill into and export, across all your sites.
A site's Overview tab shows current occupancy and how many units are available, reserved or blocked. In the Analytics dashboard you can report occupancy by unit count or by area. Area is the truer number when your unit sizes vary, because one empty 10×30 costs more than three empty lockers.
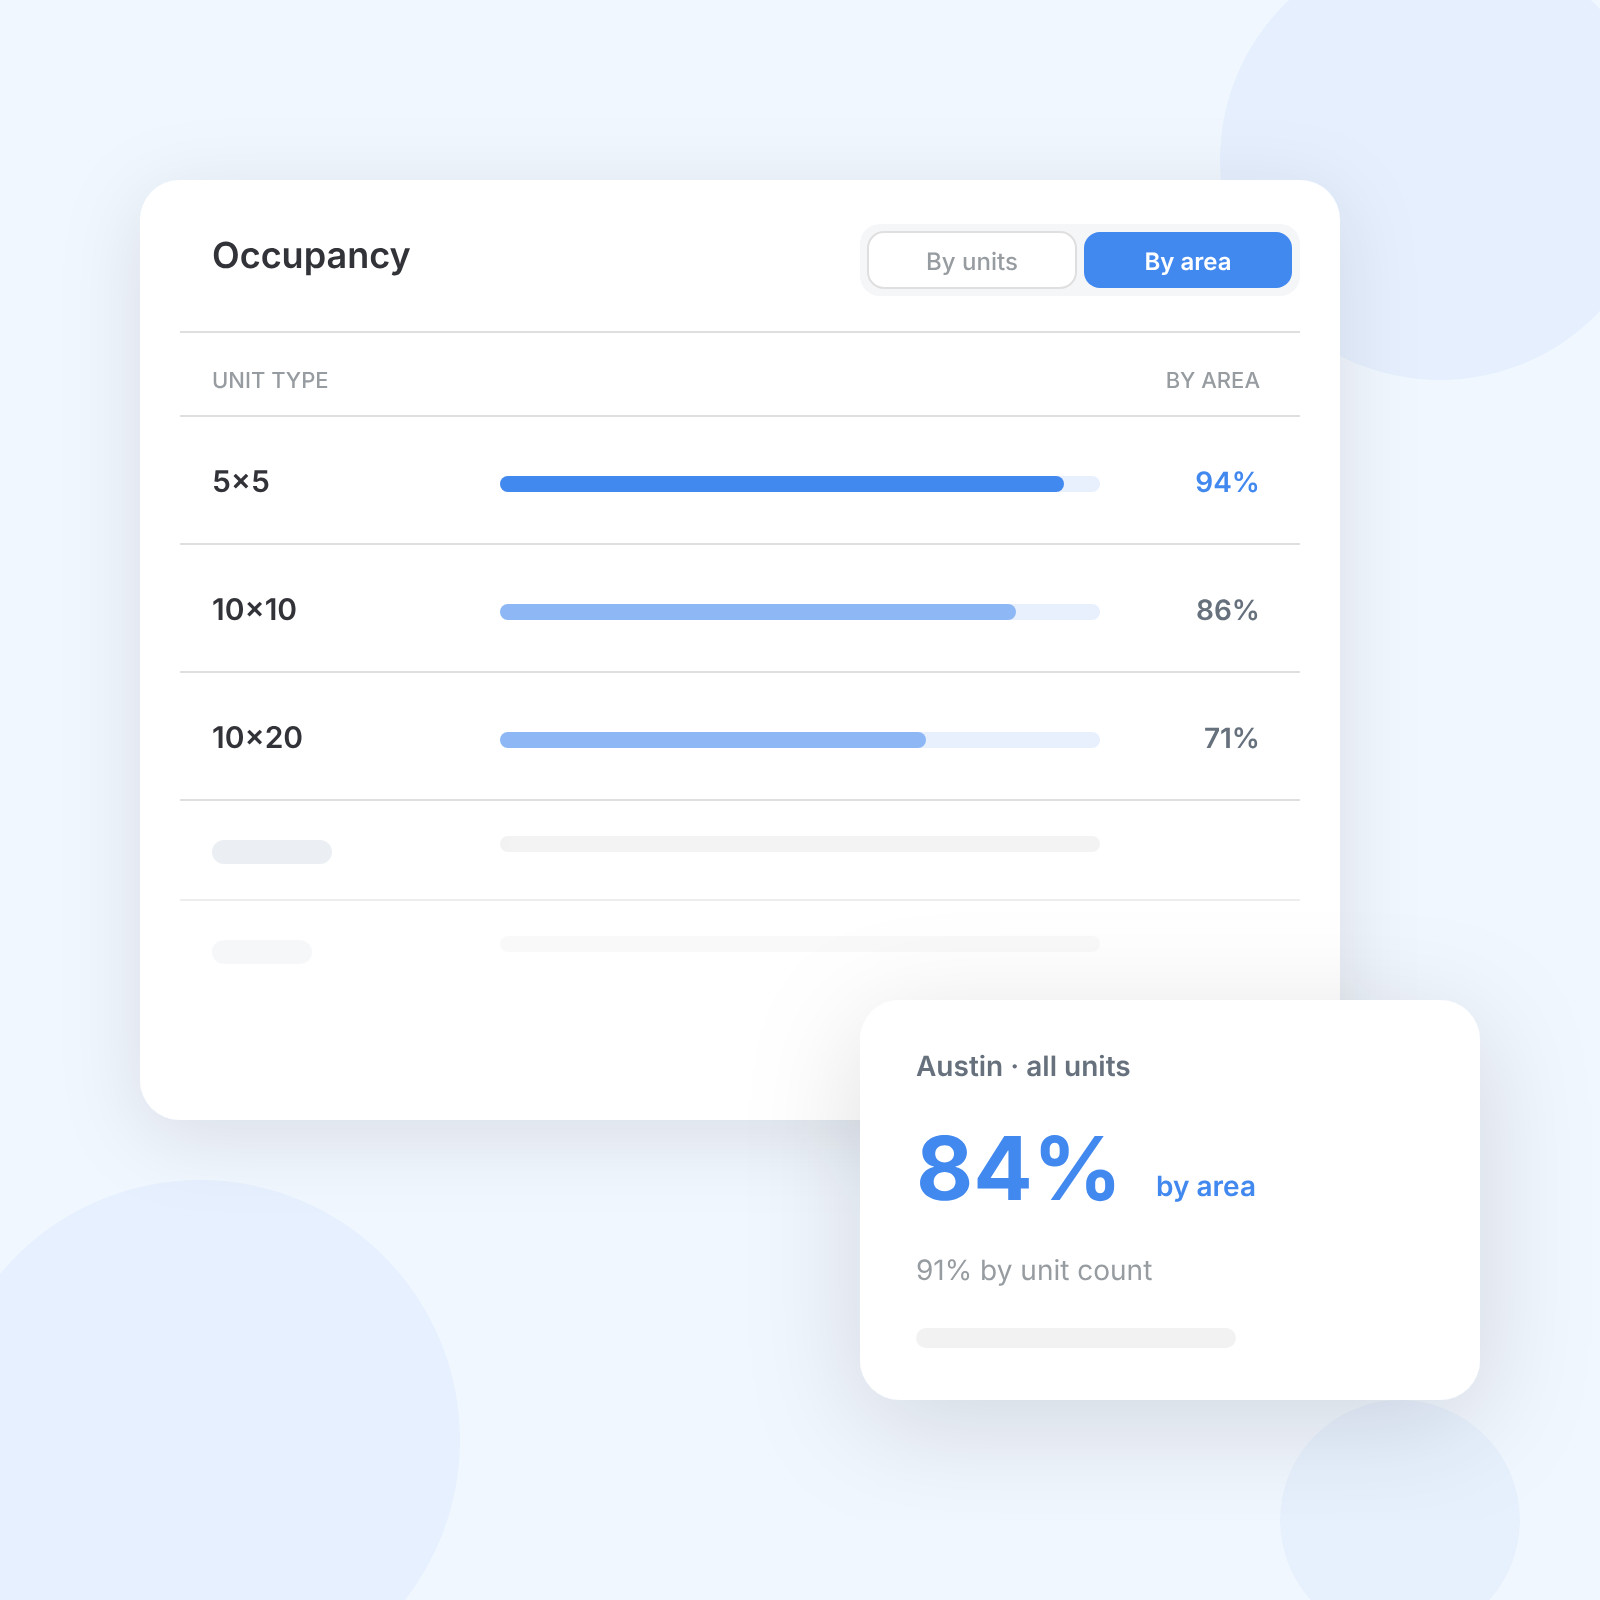
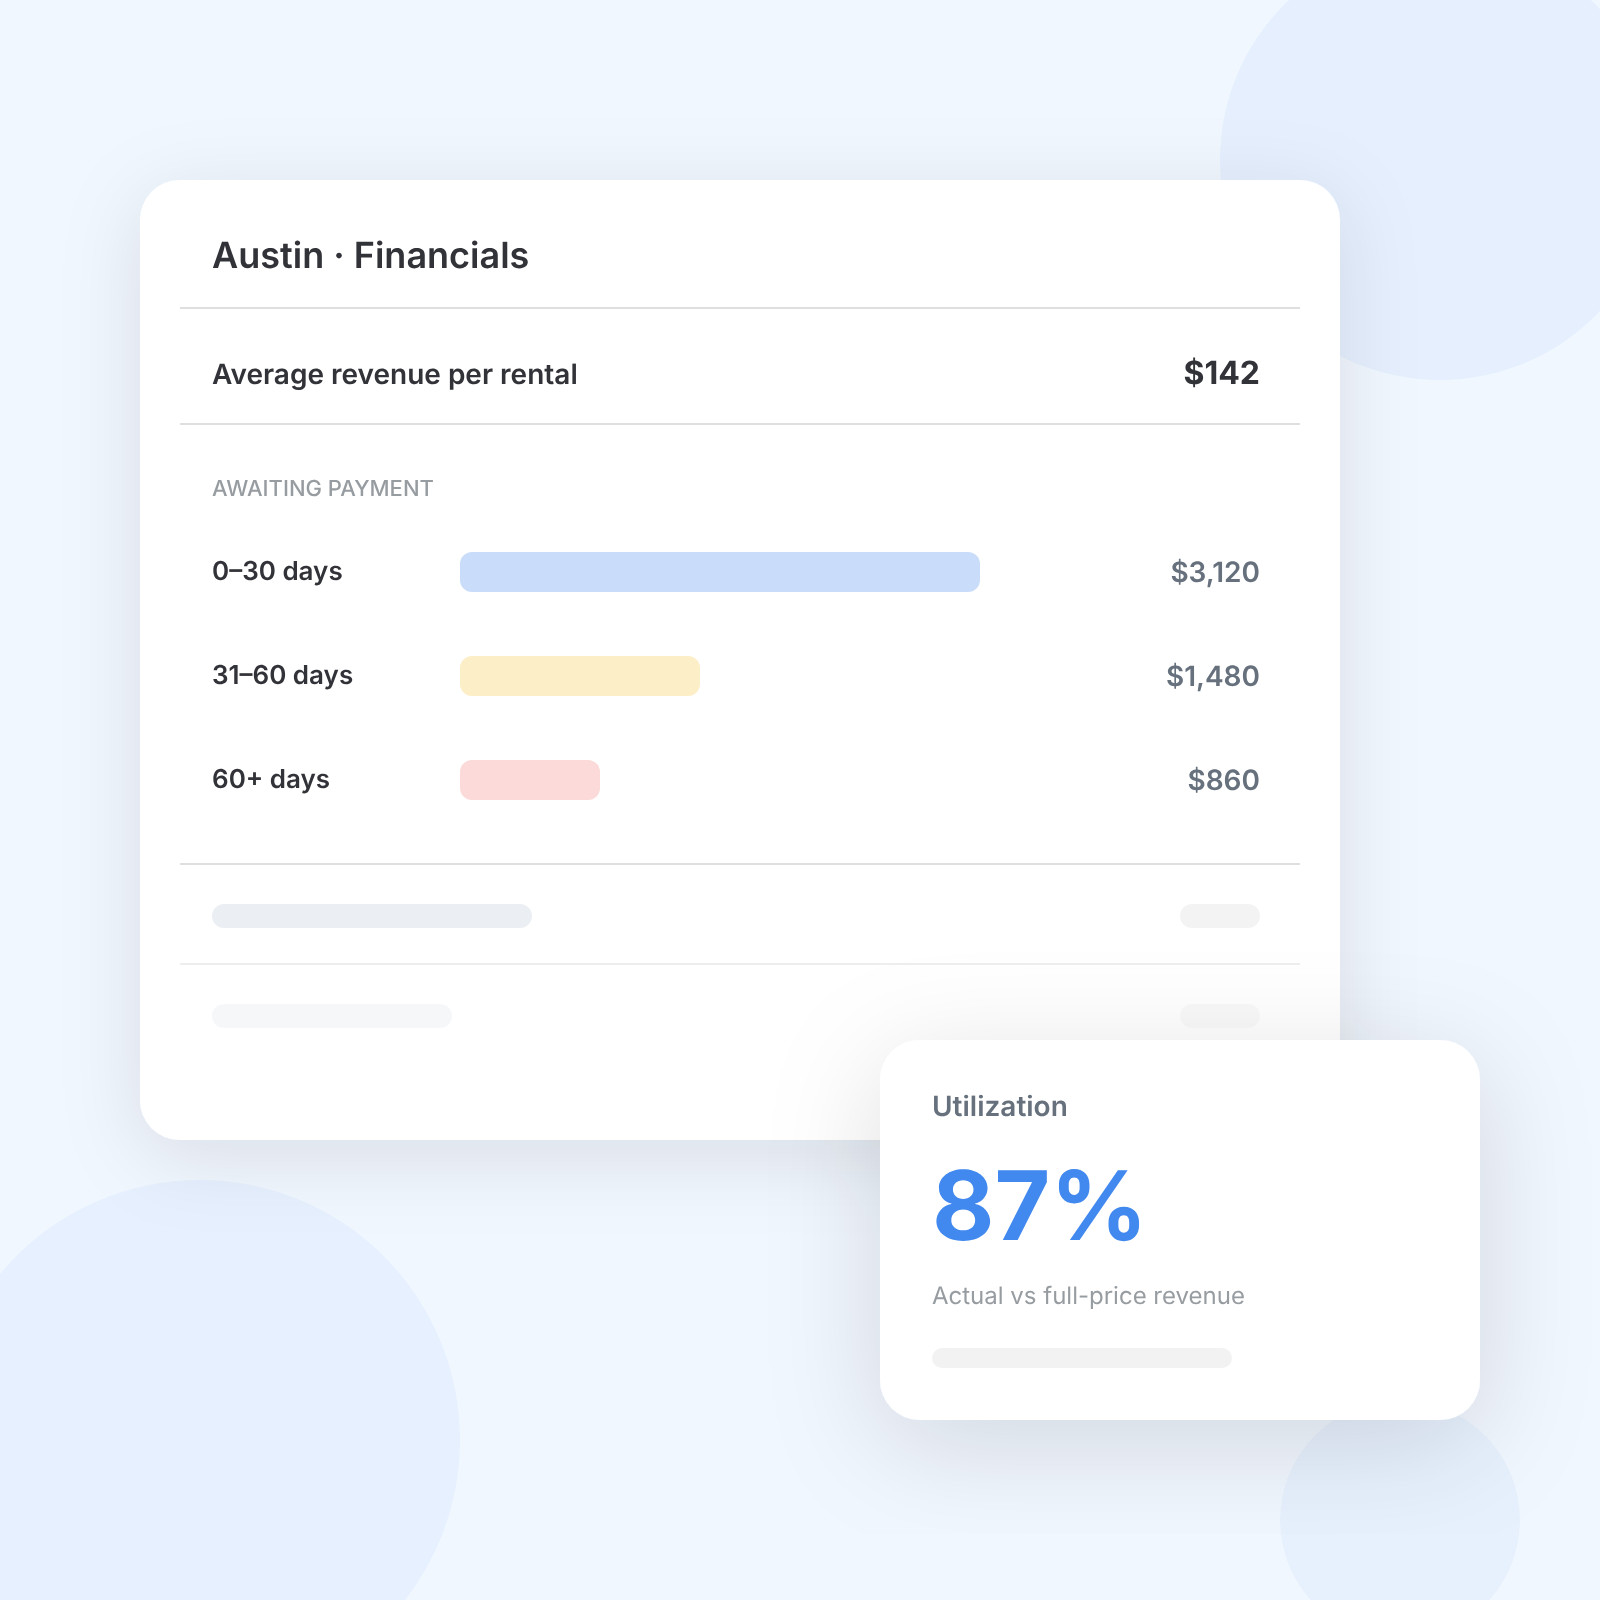
The Financials view compares the revenue a site collects with what it would earn at full price. It also shows average revenue per rental and how much is awaiting payment, grouped by how overdue it is. The 12-month revenue trend makes seasonal swings easy to spot.
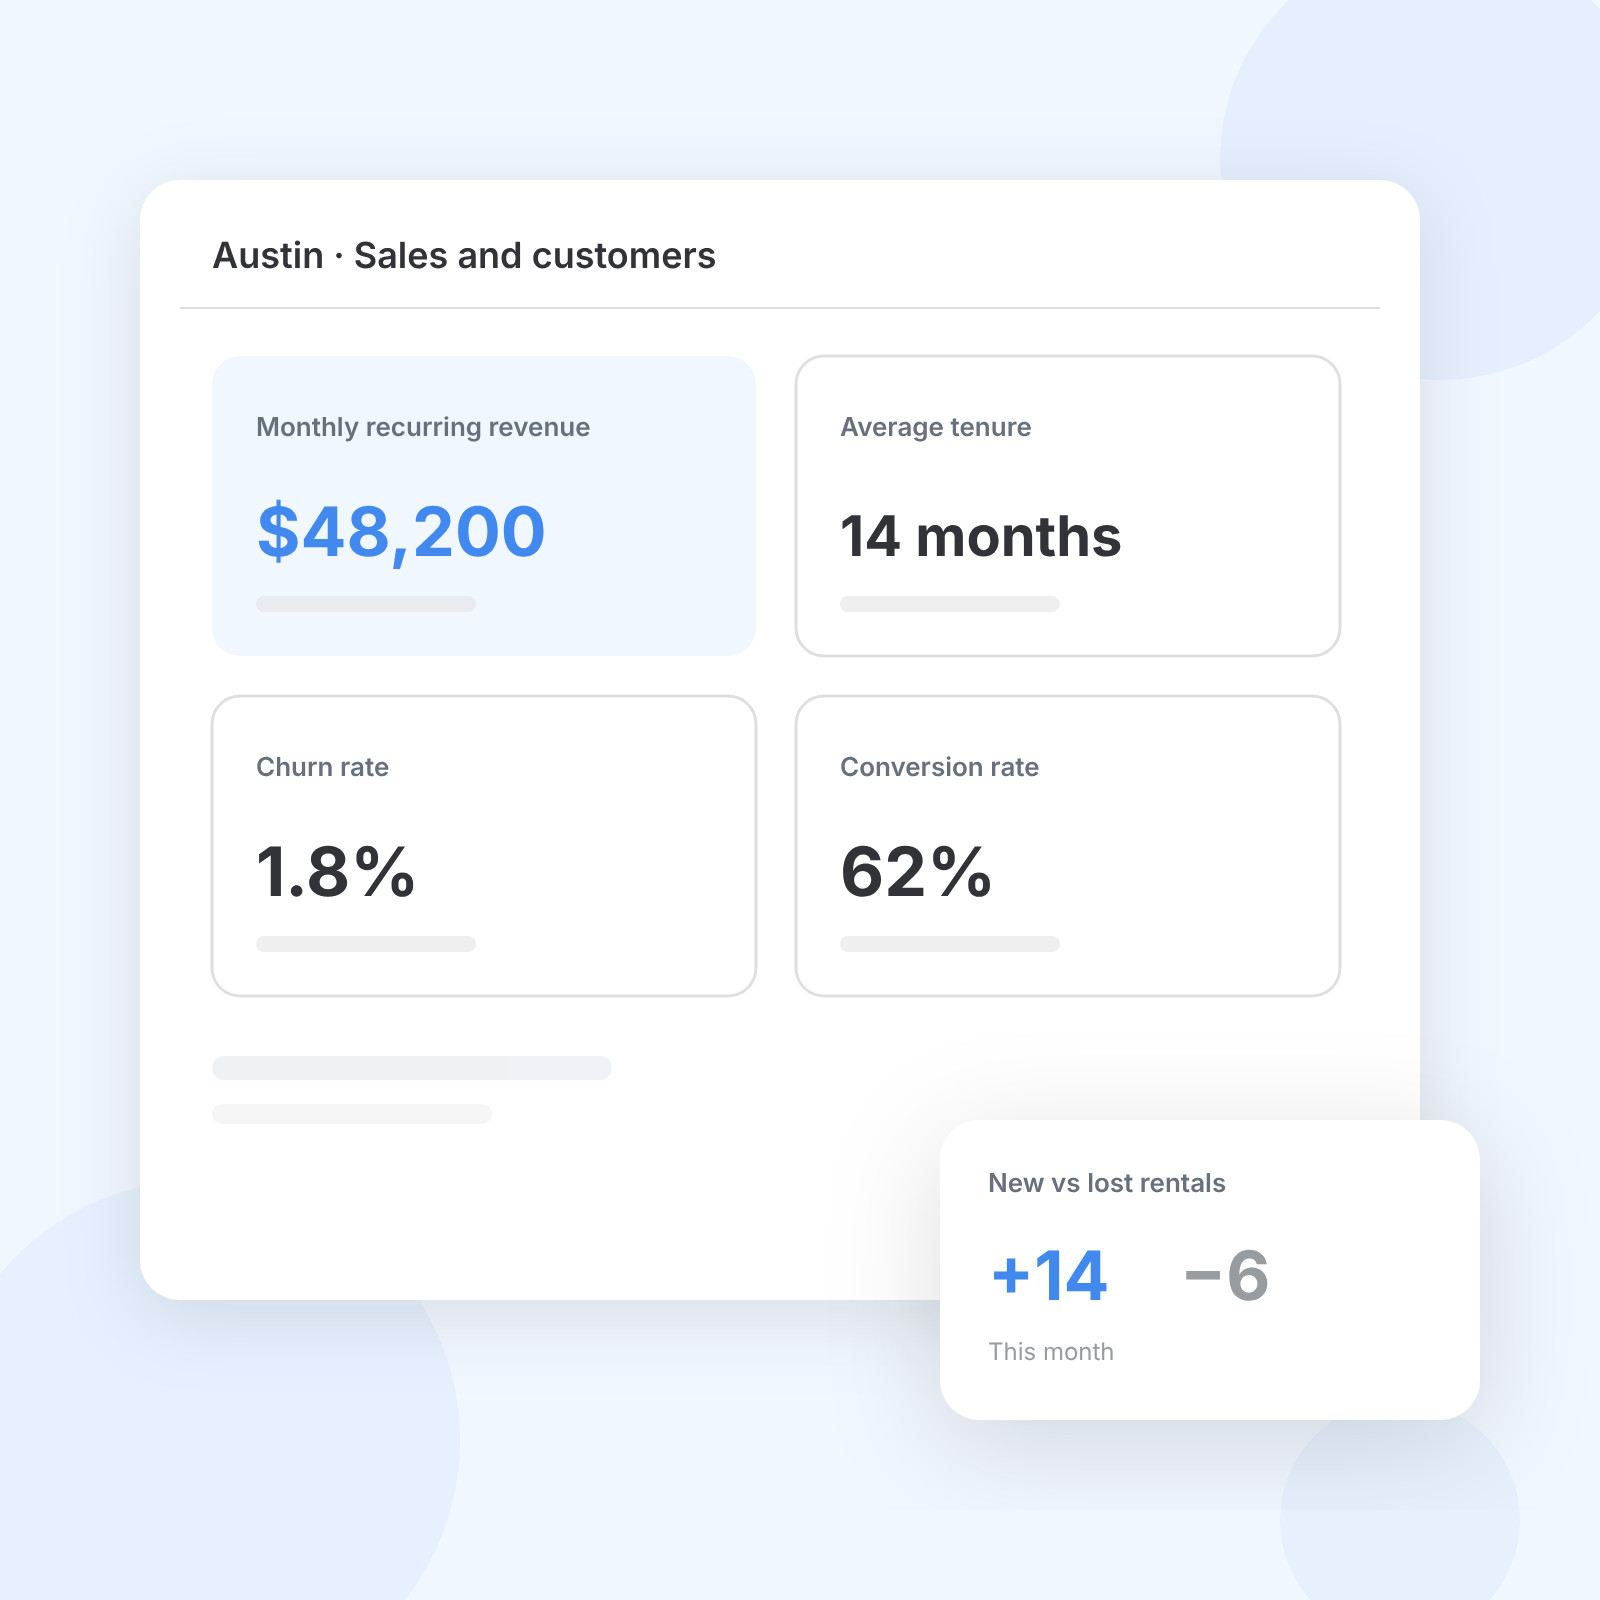
The Sales view covers availability by unit type, upcoming reservations, how far ahead people book and your conversion rate. The Customers view adds monthly recurring revenue, top customers, average tenure, churn and new versus lost rentals.
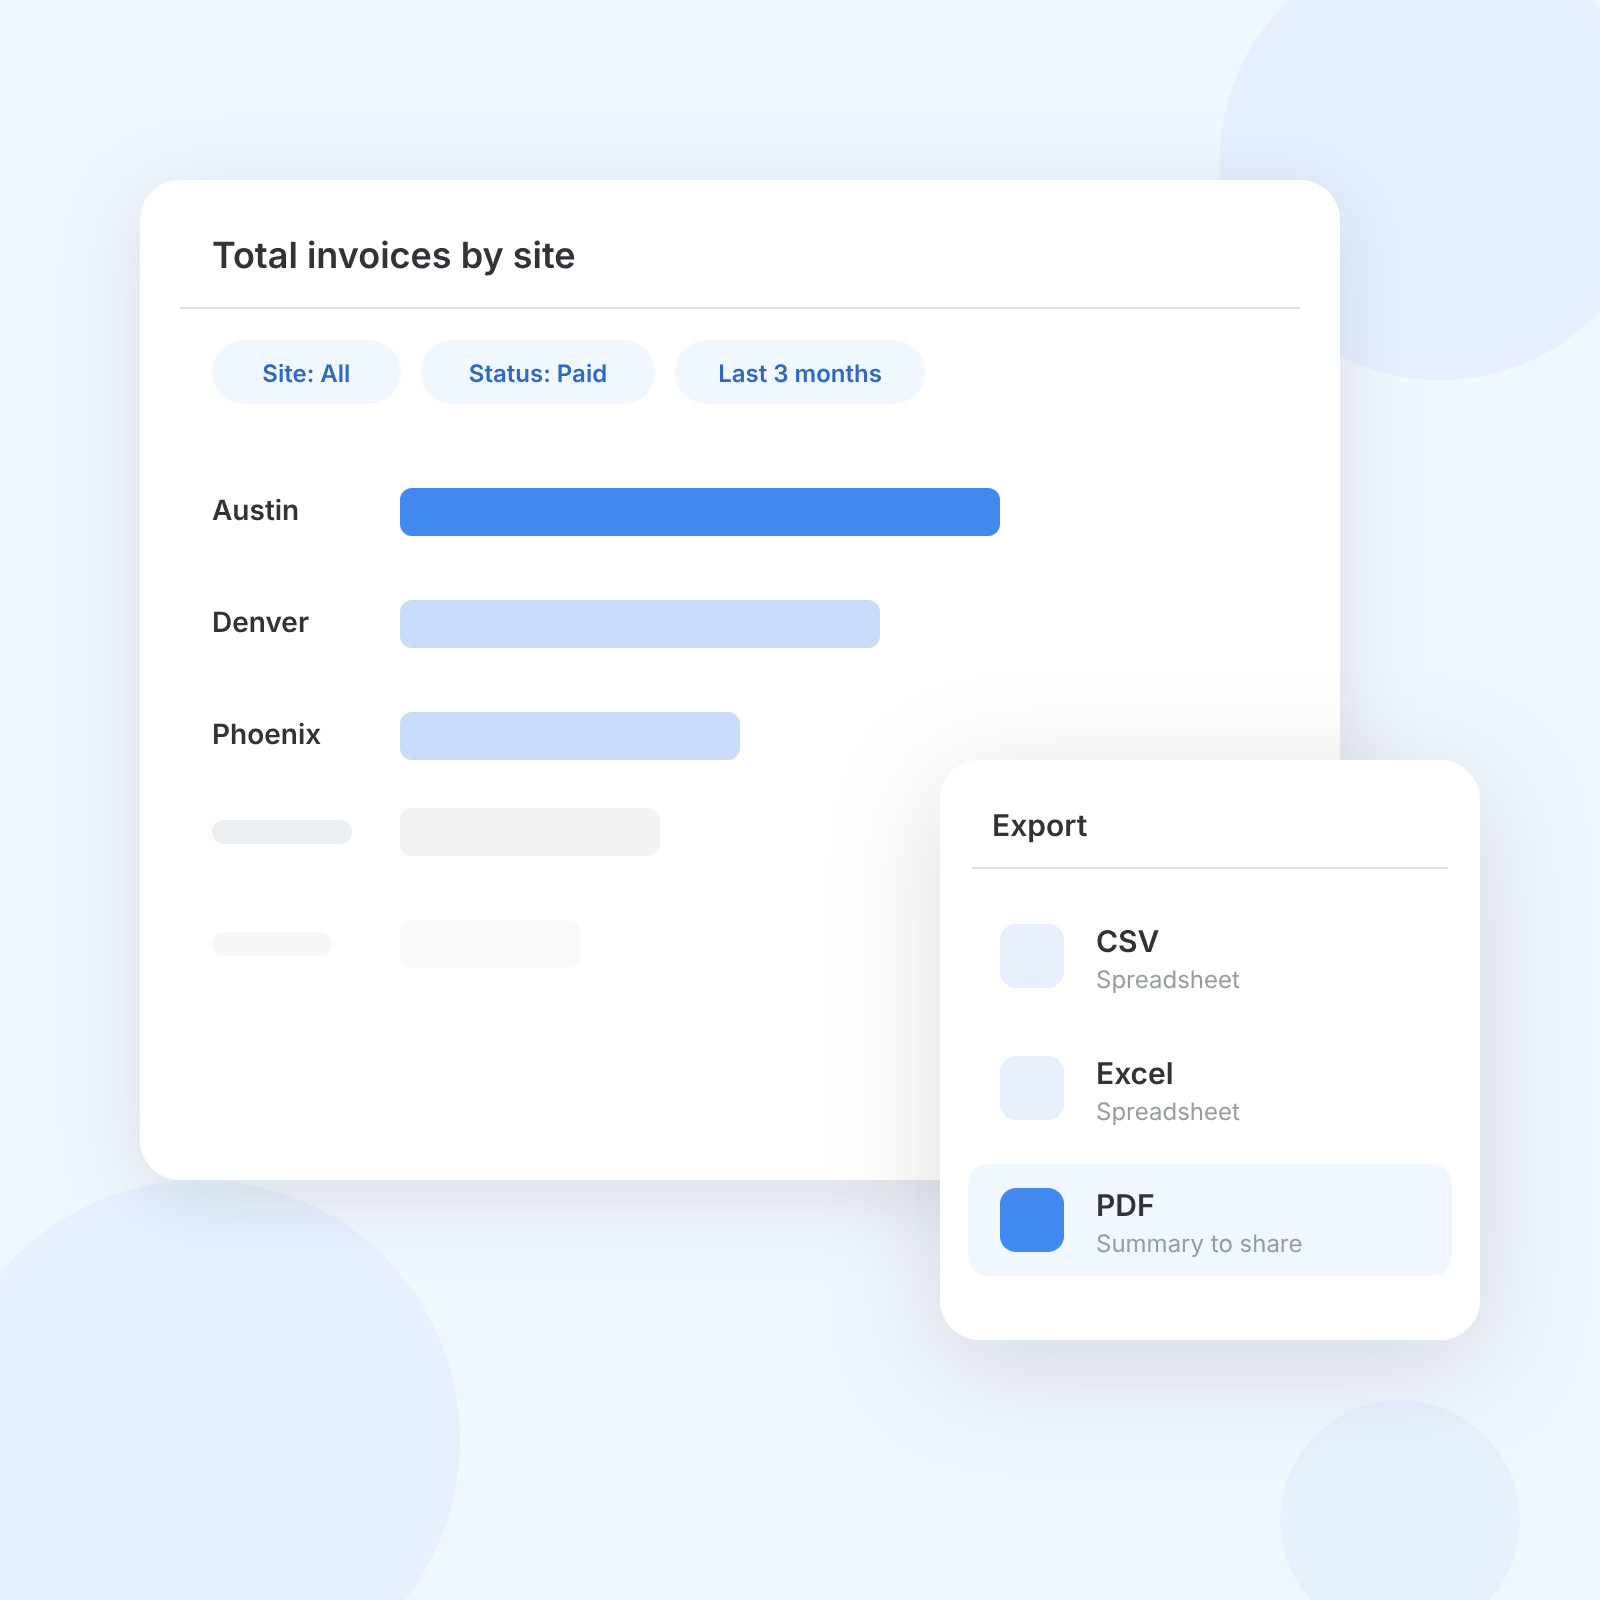
Filter any Analytics report by site, period or invoice status, click into a chart for more detail, then export it. CSV and Excel are there for your own analysis, PDF for the summary you send an owner or investor. The dashboard syncs once a day, so it's built for month-end and trend reporting.
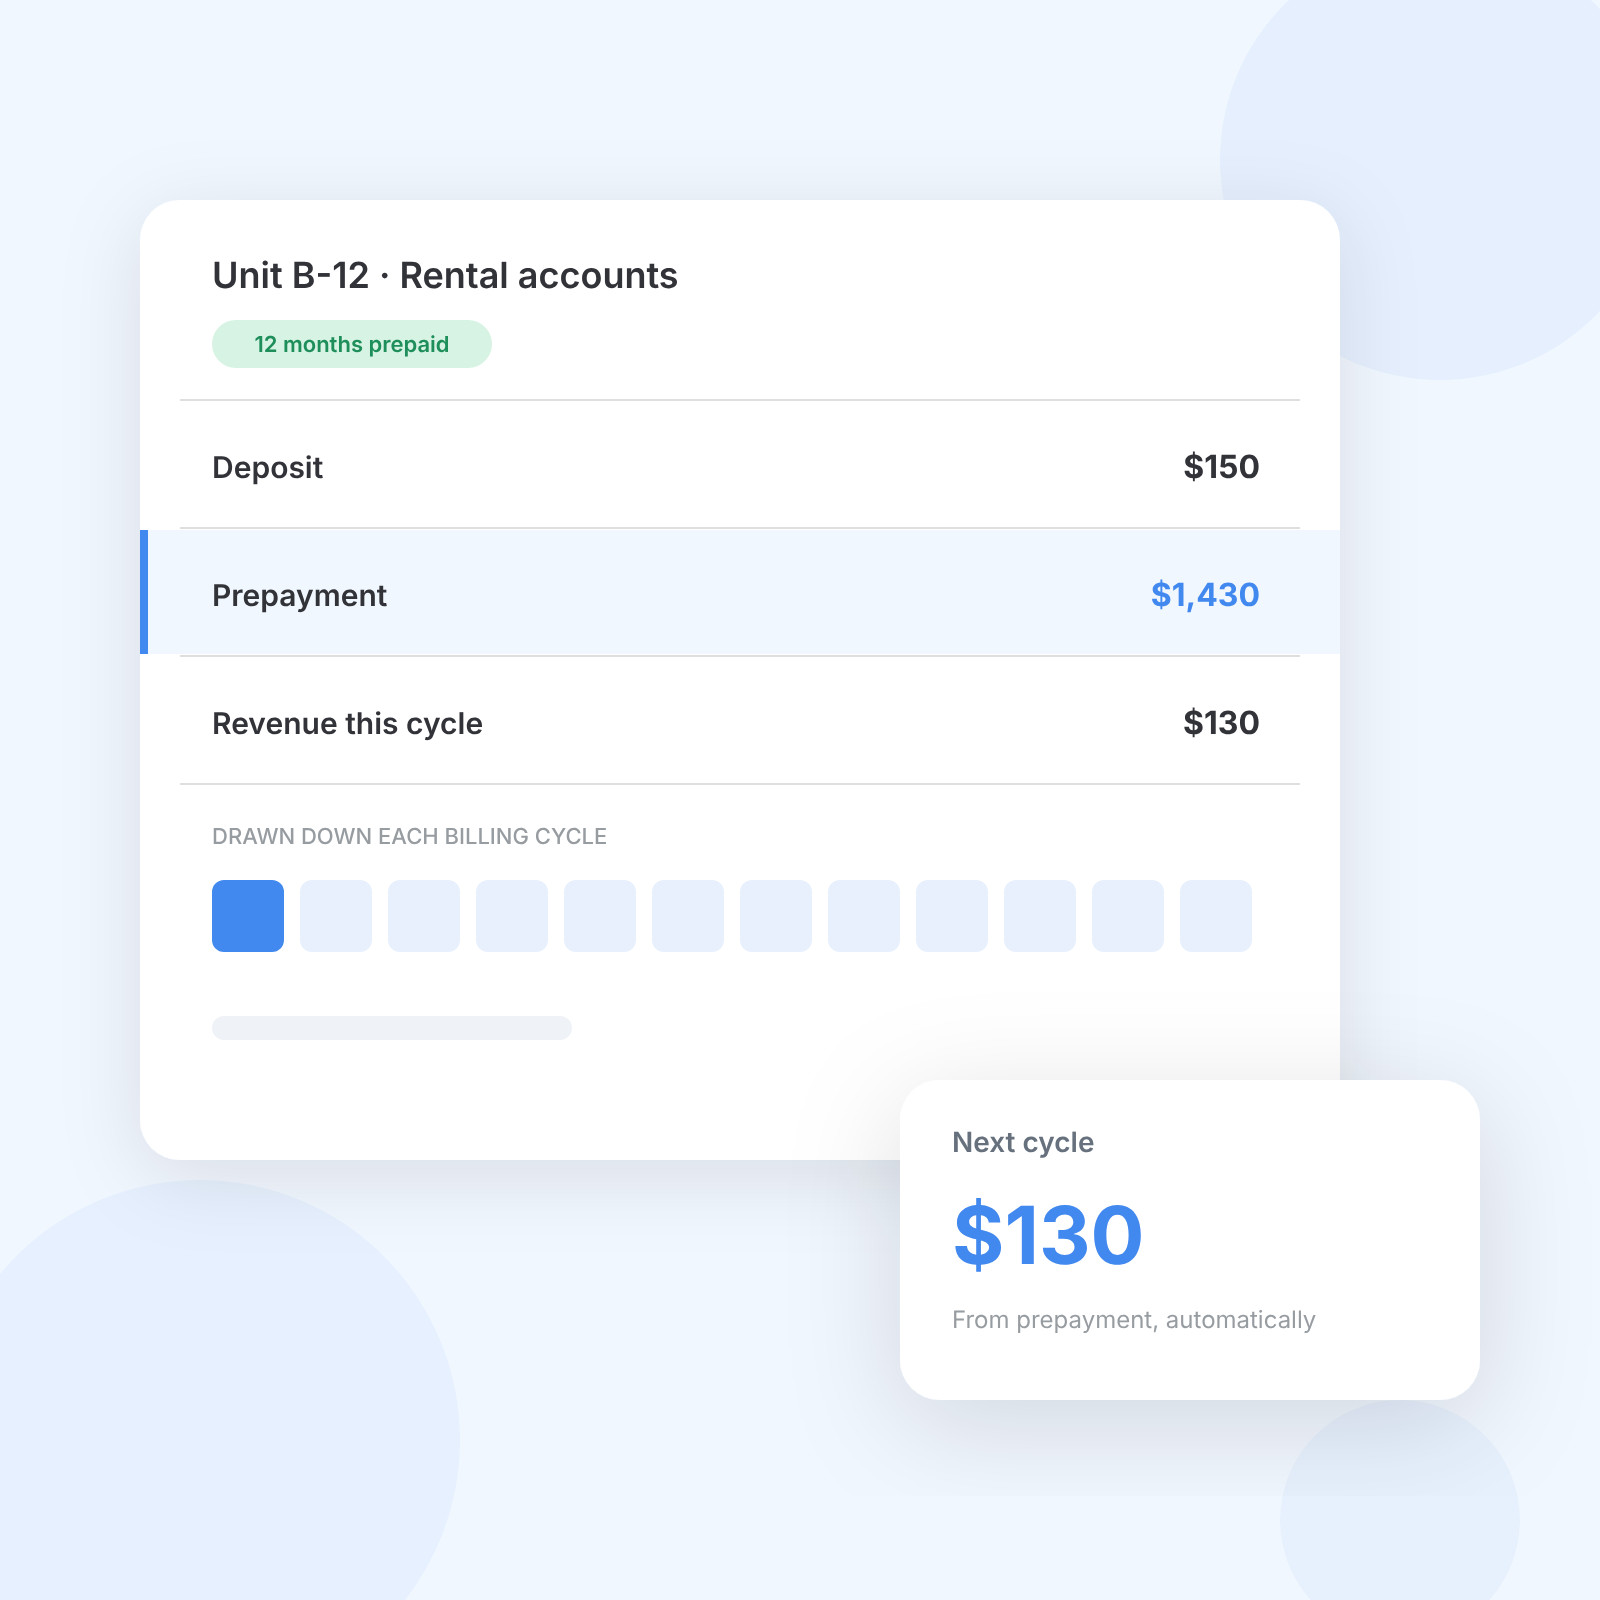
Each rental has its own deposit, prepayment and revenue account. Prepaid rent sits in the prepayment account and comes off automatically each billing cycle, so a year paid up front is drawn down month by month instead of landing in one.
The same platform runs single-site operators and Quraz's 71 facilities in Japan.
On Storeganise, through the API
71
Managed through Storeganise
40,000+
Thousands of facilities in total
50+
Zoho Analytics among them
50+
Pre-built reports, filters and exports cover the questions you get asked every month.
Five views per site
Occupancy, revenue, aging
By site, period, status
CSV, Excel or PDF
Pick the fields you need
Your data, your tools
Build deeper dashboards in Zoho Analytics, track bookings from your customer portal in GA4, or ask Claude and ChatGPT about your numbers through the AI Connector.
Revenue, occupancy and debts, broken down.

Justin Anley
Owner, Cape Storit




The site overview is already in your account.
Open any site to see its Overview tab. For filters, drill-down and PDF exports, ask us to switch on the Analytics dashboard.
Switch to StoreganiseOpen a site and check its Overview tab.
Ask our support team to switch on the Analytics dashboard.
Filter a report, then export it to CSV, Excel or PDF.
Reports tell you where to look. These parts of Storeganise help you do something about it, from pricing to collections.
Start with occupancy (by unit count and by area), revenue against what you'd earn at full price, move-ins versus move-outs, overdue balances and churn. In Storeganise, each site's Overview tab shows these on one screen, and the Analytics dashboard lets you compare them across sites and over time.
Unit occupancy is occupied units divided by total units. Area occupancy is occupied square footage divided by total rentable square footage. Area is more accurate when unit sizes vary, since one empty large unit costs more than several small ones. Storeganise reports occupancy both ways.
Yes. In the Analytics dashboard, filter a report by site, period or invoice status, then export it as a PDF summary to share, or as CSV or Excel if the owner wants the raw numbers. Each site's Financials view also shows utilization, so you can explain the gap to full potential.
Yes, all of it. Every list in the Management Portal, from invoices to unit rentals, exports to CSV or XLSX, and you choose which fields to include. Analytics reports export to CSV, Excel or PDF, and the open API lets your own tools pull data directly.
Yes. The Analytics dashboard reports across all your sites, and you can filter down to one location or compare several side by side. Each site also keeps its own Overview tab, so a site manager can check their numbers without going through the portfolio view.
The Analytics dashboard syncs once a day, so it's built for month-end, trend and portfolio reporting rather than minute-by-minute tracking. For a question about right now, like how many units are free today, ask through the AI Connector, which reads your account directly through the API.
No. Every site in Storeganise gets an Overview tab with occupancy, revenue and overdue balances, including single-site operators on the plan that starts at $90 a month. Bigger portfolios get more out of the Analytics dashboard, because comparing sites is where it earns its keep.
See how Storeganise helps your self-storage operations run smarter, so you and your team can grow your business, not your workload.